Tech Salary Guide 2026: What Cloud Architects, DevOps, and Data Engineers Really Earn
How tech salaries actually compare across the Gulf, US, UK, Europe, and Asia — what moves the number, which markets are anchored on official statistics, and how to check a real range for your role and city.
- Salaries
- Tech Careers
- Job Search
Every "average tech salary" article you have read has the same problem: it quotes one number. One number cannot describe a Cloud Architect in Riyadh and a Cloud Architect in Zurich, or a Data Engineer with two years' experience and one with twelve. The gap between those cases is far wider than the gap between job titles.
So this guide does not give you a number. It explains what actually moves the number, which markets have solid public data behind them, and where to check a real range for your own role, level, and city.
The four things that set your range

Almost all of the variation in tech pay comes from four inputs, roughly in this order of impact:
- City and market. This is the single biggest lever, and it is not subtle. The same role in a high-cost US tech hub and a mid-cost European or Gulf city are different pay universes. Moving city changes your range more than moving title.
- Experience level. Junior, mid, senior, and lead are not evenly spaced. The step from mid to senior is usually the sharpest one in the whole ladder.
- Role. Architecture, data, and security roles generally sit above generalist engineering, but the overlap between adjacent roles is large — a senior DevOps Engineer often out-earns a junior Cloud Architect.
- Demonstrated skills. Two people with the same title and years do not command the same offer if one evidences the platform, tooling, and security skills the role actually asks for. That coverage is exactly what the CV Fit Score measures.
Notice that only the last one is fully in your control on a short timescale. That is where preparation pays.
Not all salary data is equal

This matters more than people realise, and most salary content hides it. There are two very different kinds of figure in circulation:
- Official statistics. Government labour agencies publish occupation-level earnings from large, methodologically documented surveys. The US Bureau of Labor Statistics (OES), the UK Office for National Statistics (ASHE), and the Government of Canada Job Bank are the reference points for those markets.
- Indicative estimates. For many markets — the Gulf, much of Europe, much of Asia — no equivalent public occupation-level wage grid exists. What circulates instead is compiled from aggregators, job ads, and self-reported data. It is useful for orientation. It is not a survey result, and anyone presenting it as one is overstating what they have.
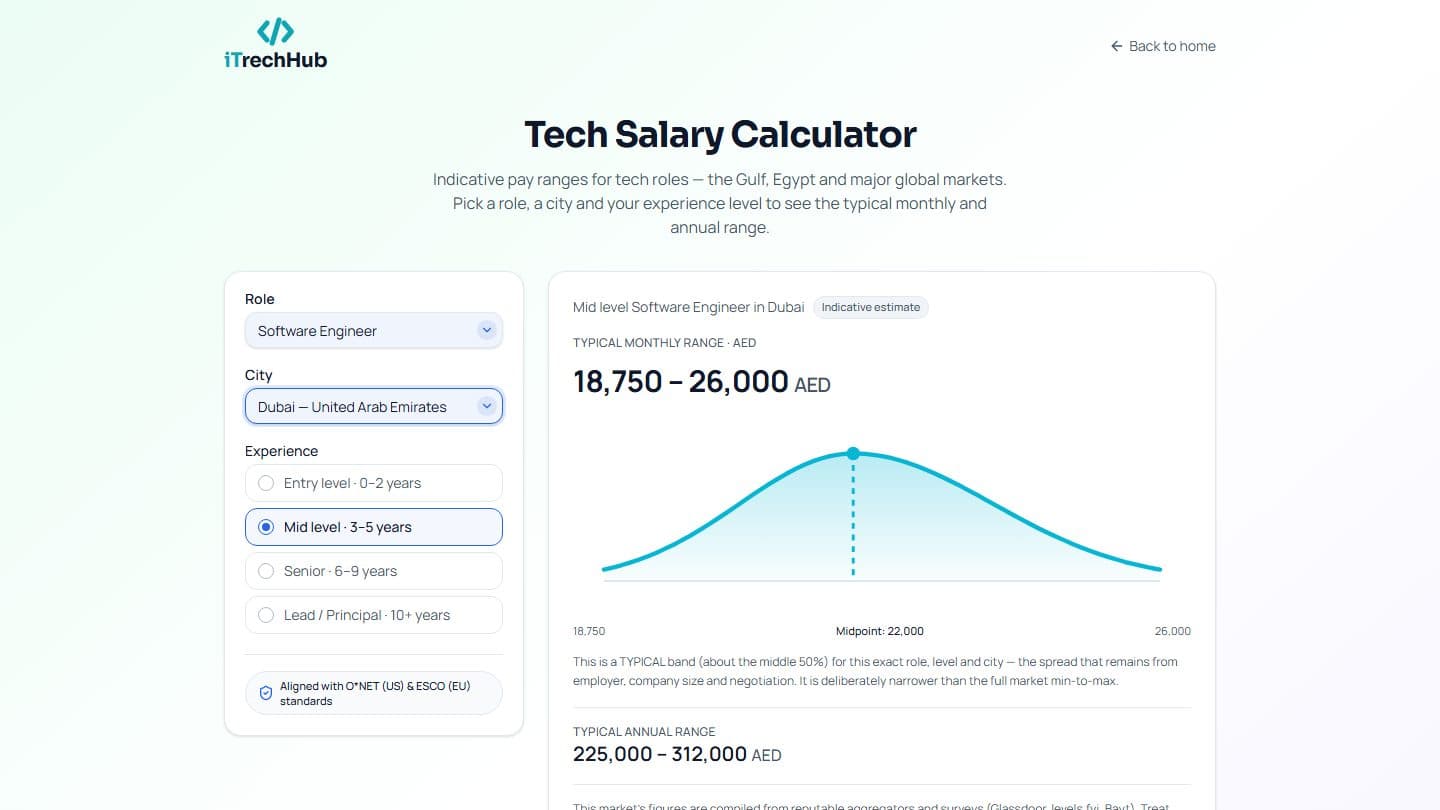
Our own salary calculator marks this distinction on the result itself, rather than blurring it: markets anchored on official statistics are labelled differently from markets where the figure is an indicative estimate. We would rather show you a smaller, honest claim than a confident one we cannot support.
How the regions differ in shape, not just size

Comparing a raw monthly figure across regions is misleading, because the structure of compensation differs:
- Gulf markets frequently package base salary with allowances, and income tax treatment differs sharply from Europe. A headline figure and take-home pay can diverge substantially.
- US roles, especially at larger technology employers, often place a significant share of total compensation in equity and bonus rather than base.
- UK and European roles tend to be more base-weighted, with statutory benefits, pension contributions, and longer notice periods forming part of the real value.
- Asian markets span an extremely wide range — a single "Asia" average is close to meaningless, since major hubs and large domestic markets behave nothing alike.
Before comparing two offers in different regions, convert both to the same thing: annual total compensation, after tax, with housing and relocation treated explicitly.
A practical way to use any salary range

- Treat a range as a distribution, not a target. Where you sit inside it depends on evidenced skills and interview performance.
- Check the range for your city, not your country. National averages hide the variation that actually affects you.
- Check one level up and one level down. If your current range overlaps the level above, that is your strongest argument in a promotion or offer conversation.
- Re-check when your skills change, not just when you change jobs.
- Ignore any figure that does not say when it was compiled and where it came from.
Once you have the range, the next question is how to use it in an actual conversation — that is covered in our region-by-region negotiation guide.
Check your own range

The iTrechHub salary calculator covers the tech roles in our shared role taxonomy across Gulf, US, Canada, UK, European, and Asia-Pacific cities. It shows the range for your role, level, and city, tells you which sources anchor that market, and shows the date the underlying figures were compiled — so you can judge the number instead of trusting it.
If you are on the Max plan, the estimate is also adjusted by the skills your profile actually evidences, so the range reflects your CV rather than just your job title. Not sure your title maps cleanly to a standard occupation? The role glossary shows the official O*NET and ESCO definitions behind each one.